
Over 800,000 vertical profiles of Temperature and Salinity have been collected since 2004 in the World Ocean by attaching tags on marine mammals, such as Southern elephant seals.
In this website, you will find information about the marine mammal tagging programs, and an access point to the publicly available databases.
Please let us know if you are using our data. You can contact us by mail to info@meop.net if you have any question.
The MEOP data portal
Content of the website
Data processing and validation
• tag-by-tag data visualization and editing of profiles (semi-automatic procedure)
• adjustment of salinity profile data. These corrections are determined based on comparisons with historical CTD and Argo data, or by cross-comparison between different tag datasets. Adjustments applied on salinity data are especially critical to achieve a level of accuracy suitable for oceanographic and climatic studies (see Roquet et al., 2011, Roquet et al. 2014).
• A thermal cell effect correction has been applied on temperature and salinity profiles for the entire database. Details of the method can be found in Mensah et al. 2017 and Siegelman et al., 2019.
• A density inversion removal algorithm is also applied, which seeks the minimum adjustment on the salinity profile to achieve neutral stability (adapted from Barker and McDougall, 2017).
• quality-control of the adjusted data set, using statistical metrics and comparisons with historical profiles (see validation below, Roquet et al. 2014).
• storage and distribution of data in a standardized netCDF format
The database comprises profiles of temperature (°C) and practical salinity (psu) as a function of pressure (dbar). Each profile is located in space and time. It must be emphasized that the dataset of each individual CTD-SRDL has been edited and corrected separately, as a given CTD-SRDL has its own specificities in terms of data accuracy and quality of the estimated correction.
A post-processing procedure is applied on hydrographic data in order to ensure the best possible data quality. This includes :
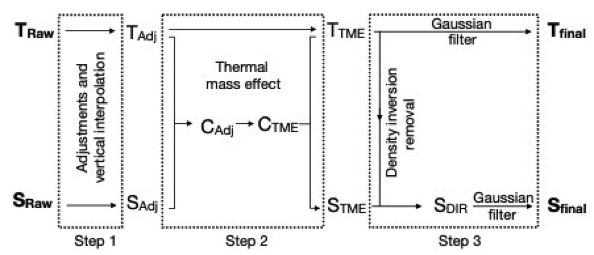
Schematic summarizing the correction procedure implemented for CTD data in the MEOP-CTD database.
Adapted from Siegelman et al., 2019
The CTD data distributed via the MEOP portal has an accuracy level that can vary depending on the considered CTD-SRDL, based on the tag version, the water mass properties or the vertical sampling of profiles. Overall, once adjusted and validated, a minimal data accuracy of ±0.03°C and ±0.05 psu can be assumed.
For high-resolution data, accuracies are estimated to be of ±0.02°C for temperature and ±0.03 psu for salinity. For low-resolution data, transmitted data points have similar accuracies, however, reconstructed temperature profiles have a reduced accuracy associated with the vertical interpolation of ±0.04°C and a nearly unchanged salinity accuracy of ±0.03 psu (see Siegelman et al., 2019).
The code used to process the data is publicly available on GitHub.
Validation
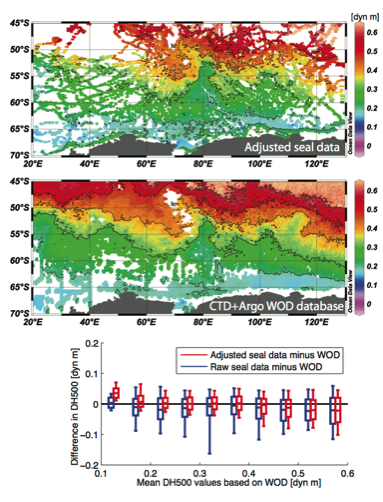
Here we consider the dynamic height anomaly at 20 dbar relative to 500 dbar (here denoted as DH500) to validate the seal database from the Southern Indian Ocean sector, comparing its spatial distribution based on raw and adjusted seal data with the distribution obtained using hydrographic profiles present in the World Ocean Database (WOD) for the period 2000 to 2013 (from Roquet et al. 2014).
The surface dynamic height anomaly relative to a given reference pressure level is obtained by vertically integrating inverse density anomalies. It is a key quantity in physical oceanography
because its horizontal gradient is directly proportional to the large-scale (geostrophic) currents. It is also a useful quantity to validate seal data, because it provides a single scalar quantity for each profile that depends on both temperature and salinity profiling data.
On the lower panel, the mean and standard deviation of the differences with WOD-based DH500 values binned using a 0.05 dyn m interval are presented for both raw (blue) and adjusted (red boxes) seal data. Adjustments on seal data improve significantly comparisons with WOD data, as can be seen from the overall reduction of both mean and standard errors as compared to WOD data.